Fibonacci for User Stories – How & Why to Use Relative Story Points

Imagine you’ve scheduled an Uber from the airport but instead of providing an ETA, the app tells you “Your ride will arrive when they arrive.” You would probably be frustrated with such an ambiguous estimation.
Would you be better off finding another ride? Will you have time to grab lunch? Should you tell your customer that you’ll be late for your meeting?
Setting vague expectations is often how product development teams respond when their stakeholders ask when a project will be done.
The value of measuring scope & velocity
Being unsure about the relative size, scope or estimated delivery time frames of releases makes it difficult to run a business. This information is needed to:
- Prioritize deliverables
- Coordinate release plans between internal departments and external stakeholders
- Make trade off decisions between different initiatives
Resources are limited. Business decision makers need to understand the benefits and the costs of certain initiatives.
Understanding scope
So how can product development teams provide reasonably accurate estimations of story sizing and delivery time frames?
First, they must understand the scope of the project. Second, they must understand their velocity.
Returning to our Uber example—to measure scope—the app uses variables like traffic and road conditions. To measure velocity, the app uses speed limits. Combining the scope and velocity contribute to the app’s ability to measure a reasonable estimated time of arrival of the driver.
The same is true for delivering software. Scope varies between one project to the next. The size and complexity of a solution may have been simple on the last project.
The next project may present complexities that are outside of the development team’s expertise. The more complex a solution is, the slower the team will be at planning, building and testing the solution.
User stories and story points
An initiative is typically broken up into bite-size user stories (sometimes “tickets”). A Scrum Team comprising developers, PO, UX designer(s) and QA tester(s) will come together regularly to have estimation sessions.
These point estimation sessions can be conducted in-person or remotely. The objectives of these sessions are to:
- Come to a common understanding of the purpose, acceptance criteria and implementation details of the user story
- Ask questions, poke holes and add any details to the ticket that may have been accidentally missed
- Determine if the ticket needs more attention away from the whole team before estimation continues
- Agree to the size of ticket in the form of story points
Since developers are the only ones who understand the technical effort of implementing a ticket, only they should estimate story points.
Measuring velocity
Velocity (aka capacity) is a measure of how many story points a development team can complete in a given time period. To calculate this, you will need to have a record of completed story points behind you already.
Velocity is measured by dividing the number of story points the team has completed in a past time period by the number of workdays (or other increment) those points were completed in.
Here is the formula:

If the team is measuring the velocity of a Sprint then they would replace # of days with # of Sprints.
How to forecast
Once the team’s velocity is measured and they have story point estimates on all of the tickets for an upcoming release, they can forecast with a reasonable level of accuracy when the project will be code-complete.
Forecasting is measured by dividing the number of story points the team is estimating a project (or group of tickets) will take to complete divided by the team’s velocity.
Here is the formula:

For example, if a team has a velocity of 20 (100 story points completed over the last 5 sprints), and the upcoming project they have scoped is 40 points total, they can forecast that they’ll be code-complete with that project in about 2 sprints (40 estimated story points ÷ velocity of 20 = 2 sprints).
Velocity accuracy improves over time
In probability theory, the law of large numbers explains that if the same exercise is repeated a large number of times then the average outcome will come close to the expected value. Even though the forecasts of some iterations will be off, the law of large numbers makes the story point, velocity and forecast averages more reliable the more times the exercises are repeated.
Time vs story points
A common mistake when estimating a user story is equating story points to time. Story point estimates are meant to measure the level of effort and complexity that a ticket represents.
A ticket that could risk destroying a table of customer data would require more effort than a simple button-text change, even if it might appear to take the same amount of time to do each task.
Relative sizing
Teams that attempt to measure time instead of effort often overlook the hidden complexities and risks that are lurking under the surface.
Executives commonly come to the development team to ask how long it would take to complete projects A, B and C but the projects are just bullet-points with no designs or requirements.
The “unknown unknowns” can make time-estimations nearly impossible and effort-estimations difficult, especially when a project hasn’t been defined in detail.
When attempting to decide what order to do upcoming projects, the relative size of each project should be considered. Relative sizing is where the Fibonacci sequence shines.
The Fibonacci sequence
A common pattern that surfaces in nature, art, architecture and music is known as the Golden Ratio. Leonardo Fibonacci was a Greek mathematician during the 13th century who popularized the mathematical version of this ratio.
It’s known as the Fibonacci sequence. Simply put, this pattern is found by adding any two previous numbers together (starting with 0 & 1) to get the next number in the sequence. It goes:
0, 1, 1, 2, 3, 5, 8, 13, 21, 34, 55, 89, 144, etc
One plus zero is one. One plus one is two. Two plus one is three. Three plus two is five. Five plus three is eight… You get the idea. Choose any two neighboring numbers from the sequence above, add them together and notice that they add up to the next number in the sequence.
How to use the Fibonacci sequence for story points
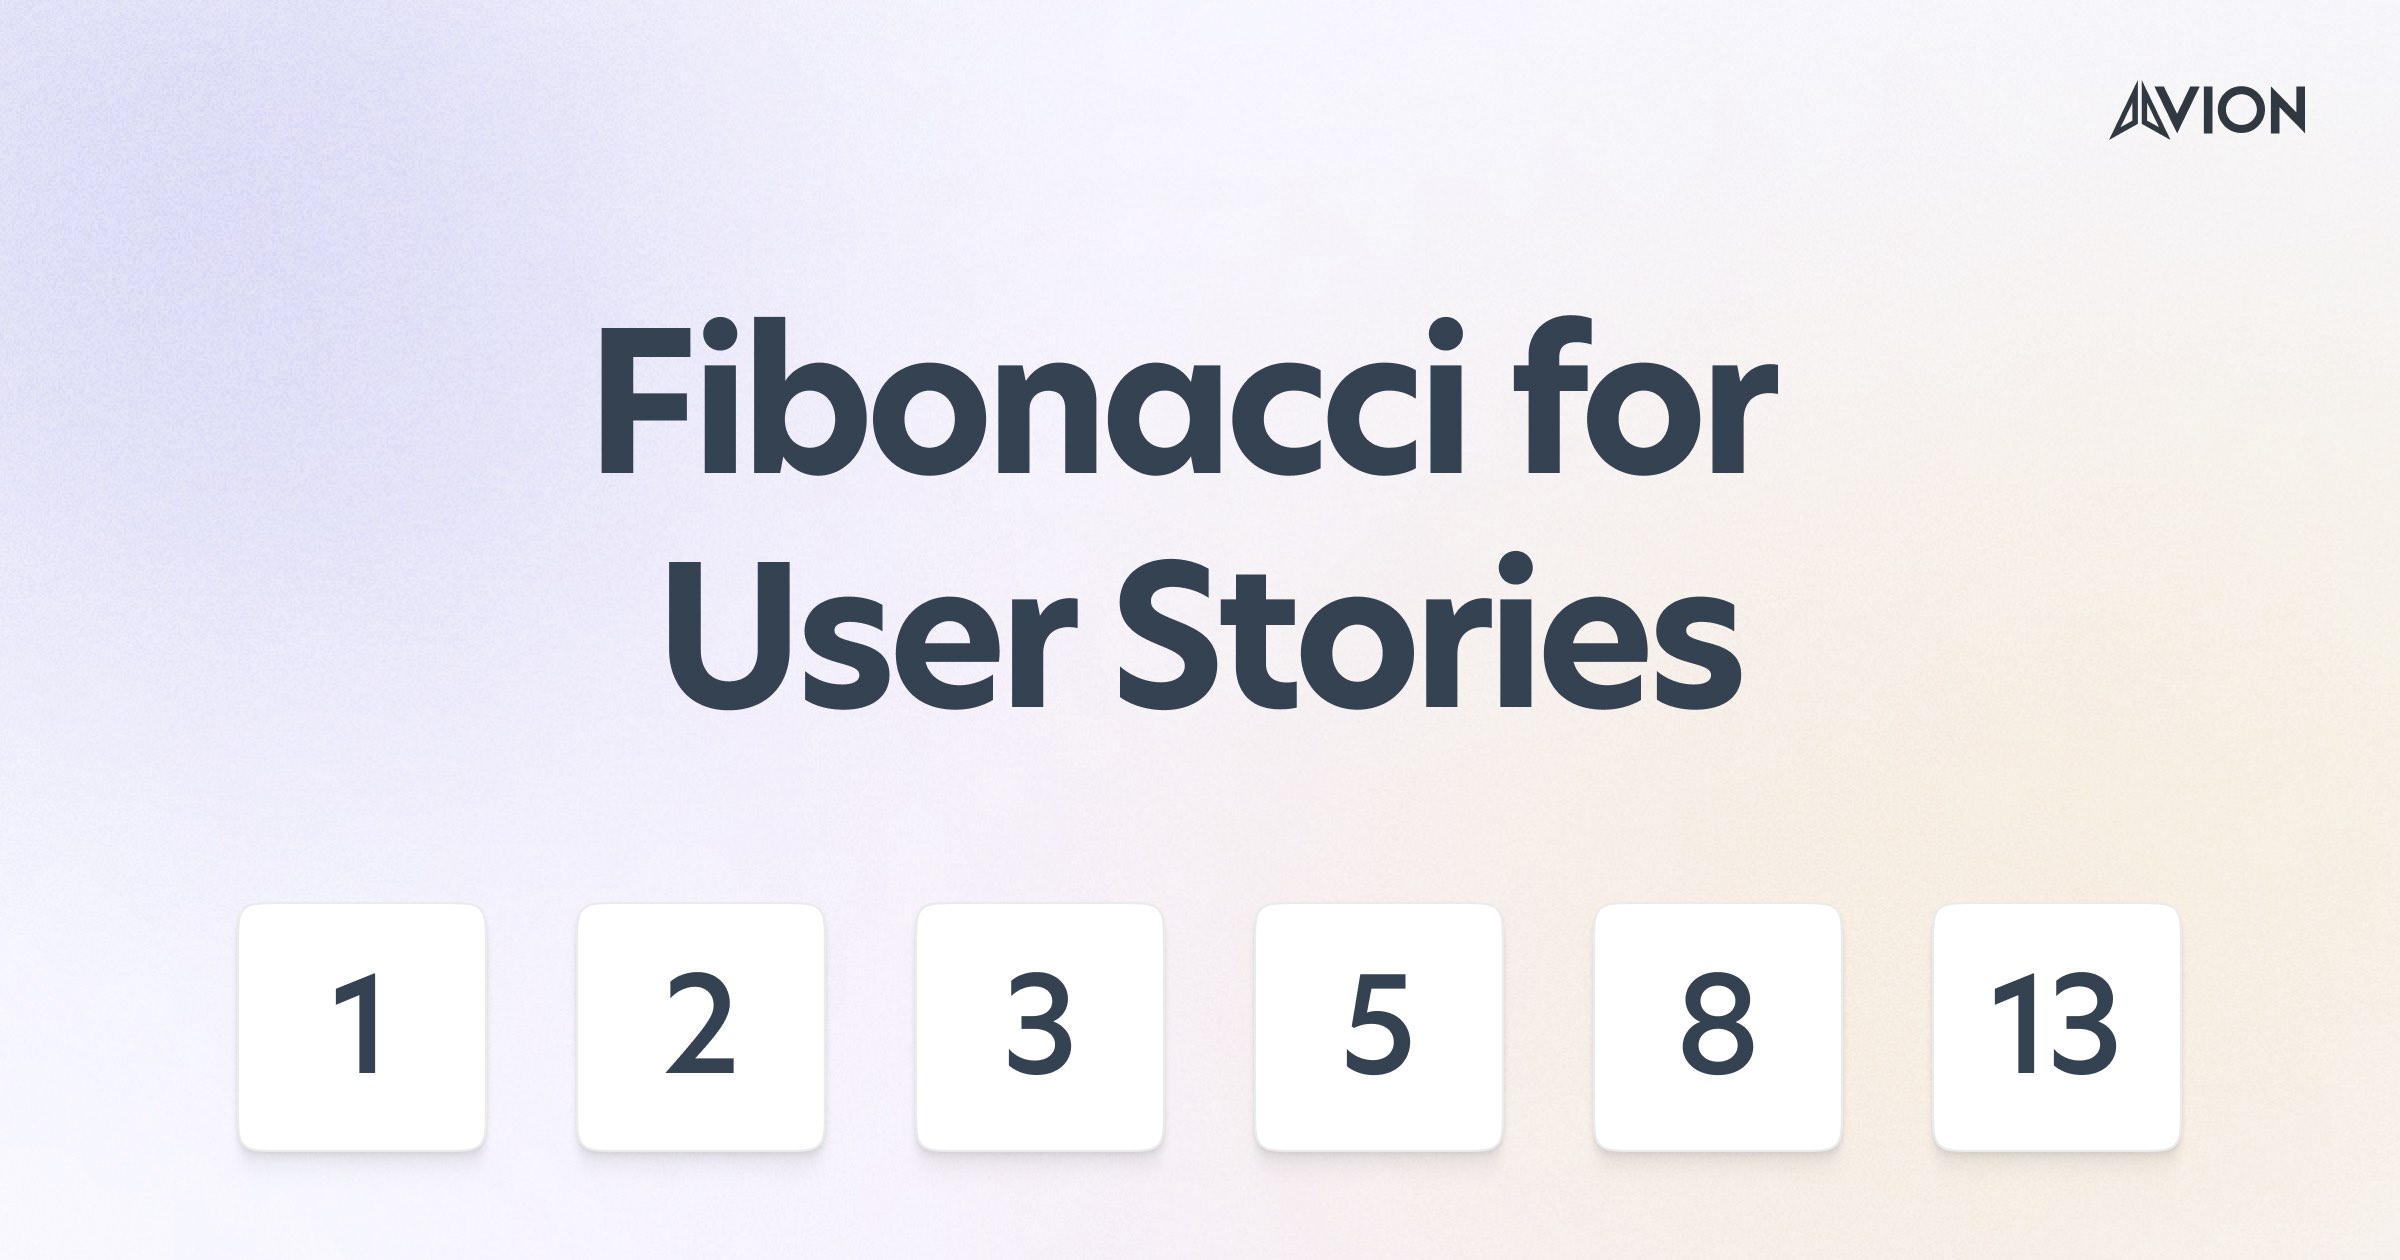
The Fibonacci sequence is often used for story points. The Fibonacci story point variation starts with 0 and typically ascends no higher than 21. It goes:
0, 1, 2, 3, 5, 8, 13, 21
Fibonacci vs t-shirt sizing
T-shirt sizing has some similarities but has a different role than Fibonacci sizing. They’re both used as a way to estimate the relative sizes of multiple efforts. The difference is that when estimating using t-shirt sizes, the estimates are typically being applied on project-level initiatives whereas Fibonacci story points are more often applied at a more granular level — user stories.
T-shirt sizes are typically measured by:
- XS (extra small)
- S (small)
- M (medium)
- L (large)
- XL (extra large)
When determining the relative sizes of a group of initiatives a team will identify the smallest effort and designate it an XS. Then the team will assign the sizes of the other projects relative to the smallest one.
Sometimes, under the pressure of executives, teams are tempted to assign time frames to t-shirt sizes but since the amount of effort won’t be clear until designs, architecture and user stories are completed, these estimates will almost always be off.
Since t-shirt sizes represent estimates for a project with a minimal amount of information, the estimates are low-confidence. As the fidelity of projects take shape in the form of user stories, estimates become higher-confidence via Fibonacci story point values.
Why use Fibonacci for story points?
The main benefit of using the Fibonacci sequence for story points is that it provides a process to scope user stories relative to each other.
As a starting point, it’s helpful to determine what the smallest effort could look like and designate that as a 0 or 1 pointer, depending on what the team has designated as the smallest.
A simple text change could be a good baseline for what the smallest effort looks like. A 2 pointer should be double the complexity of a 1 pointer. As the complexity of user stories increase, the story points grow proportional to the stories' estimated effort. As the complexity grows, Fibonacci story points grow exponentially.
It’s best practice to keep user stories as small as possible. When a user story is larger than a 5 or 8, it’s a good opportunity for the team to discuss how to break the story up into smaller tickets.
The psychology behind using the Fibonacci sequence for story points
There are some principles rooted in psychology and sociology that show why using the Fibonacci sequence for story points makes sense. Before exploring those benefits, it’s important to understand a few barriers that make people naturally bad predictors.
- The illusion of validity teaches that people tend to think they’re better at predicting outcomes than they actually are.
- Similarly, the planning fallacy teaches that people tend to be overly optimistic and therefore underpredict how much time something will take to complete.
Combine the illusion of validity with the planning fallacy and it’s no wonder why there are so many missed expectations. Many development teams start out optimistic about the size of a project. As planning and development progresses, deadlines keep getting pushed out “just one last time”.
As researchers Jim Collins and Morten Hansen discovered after evaluating 20,400 companies, with the exception of seven companies, the top companies were no better at forecasting than the less successful companies.
Relative sizing, just-noticeable difference & Hicks Law
While using Fibonacci story points is not the cure-all for making accurate estimations, it does help in several ways.
Just-Noticeable difference (JND) is the relative degree something has to change in order for the difference to be noticeable. When it comes to making point estimates on user stories, long debates can occur about the difference between a 12 pointer and a 13 pointer.
The relative differences between two sequential numbers on a linear scale fall below the just-noticeable difference threshold, especially as those numbers get higher. Fibonacci provides a sequence where the differences between each value are large enough apart that they are above the just-noticeable difference threshold.
Hick’s Law teaches that the time it takes for a person to make a decision increases exponentially the more options there are.
For example, the higher the number of steps there are in an online purchase flow, the lower likelihood there is that a user will complete that purchase.
When it comes to point estimates on user stories, the more numbers there are on a scale for a development team to pick from, the lower the likelihood there is that the team will agree on that value. Using Fibonacci for story point estimations limits the number of options to eight.
Using Fibonacci for story points combines the benefits of JND and Hick’s Law. The likelihood that a team can both perceive a large enough difference between point values and not be overwhelmed by a high number of values to choose between streamlines a team’s sizing process.
Planning poker
Planning poker is the gamified process by which development teams estimate story points utilizing Fibonacci. It can both speed up the estimation process and make it fun.
How does planning poker work?
- The development team comes together for an estimation session.
- Each developer gets a deck of Fibonacci cards. As mentioned earlier, a common sequence for planning poker cards are 0, 1, 2, 3, 5, 8, 13 & 21.
- The team reviews a ticket until everyone’s questions are answered.
- Each individual developer chooses their card.
- Once everyone is ready to estimate, the Scrum leader counts down “3, 2, 1” and then every developer raises the card representing their estimate.
- If there are differences between estimates then the team has a discussion (starting with the outliers) until there’s a consensus.
Sometimes steps 3-6 can be repeated until a consensus is reached. Otherwise, the Scrum leader can make a call and move on.
What are the benefits of planning poker?
This process combines the benefits of two sociological principles: crowd wisdom and preference falsification.
- Crowd wisdom is the principle that collective opinion tends to better predict outcomes than an individual’s opinion alone.
- Preference falsification describes the tendency individuals have to misrepresent their preferences under group pressures.
Planning poker combines benefits of crowd wisdom while avoiding disadvantages of preference falsification. A team arriving at an accurate sizing prediction will be more likely when done as a collective game. Likewise, the tendency for a developer to conform an estimate to what others on the team are leaning towards are avoided by the fact that each developer has to choose their cards without biasing each other and then reveal them simultaneously.
Summing up
Fibonacci, while having its limits, plays an important role in Agile development. Using Fibonacci as a framework for estimating story points creates a standard by which everyone on the team can work together quickly to:
- Understand the relative size of different initiatives so that decision-makers can make trade off decisions
- Forecast when work can be delivered
Taking the initial steps to introduce Fibonacci sizing on a team requires a slight learning curve. Results won’t be immediate. Eventually, it becomes second nature and it facilitates a low-effort flow that pays long-term dividends.
Continue reading
 Product managers are creators. They’re problem solvers. They facilitate solutions that people value.Read more
Lean Agile – Bringing Them Together To 5x Your Delivery
Lean and agile have a lot of similarities. They both focus on rapid, iterative development in order to deliver value to customers faster and avoid wasted development time by producing unnecessary features.Read more
Use Cases vs User Stories. What Are The Differences?
Whilst user stories and use cases were both designed to describe the expected system behavior from a user's perspective they are two very different tools. And whilst they do share similarities they have far more differences. Let's dig in.Read more