
The Ultimate Free User Story Mapping Template (Excel & Google Sheets)
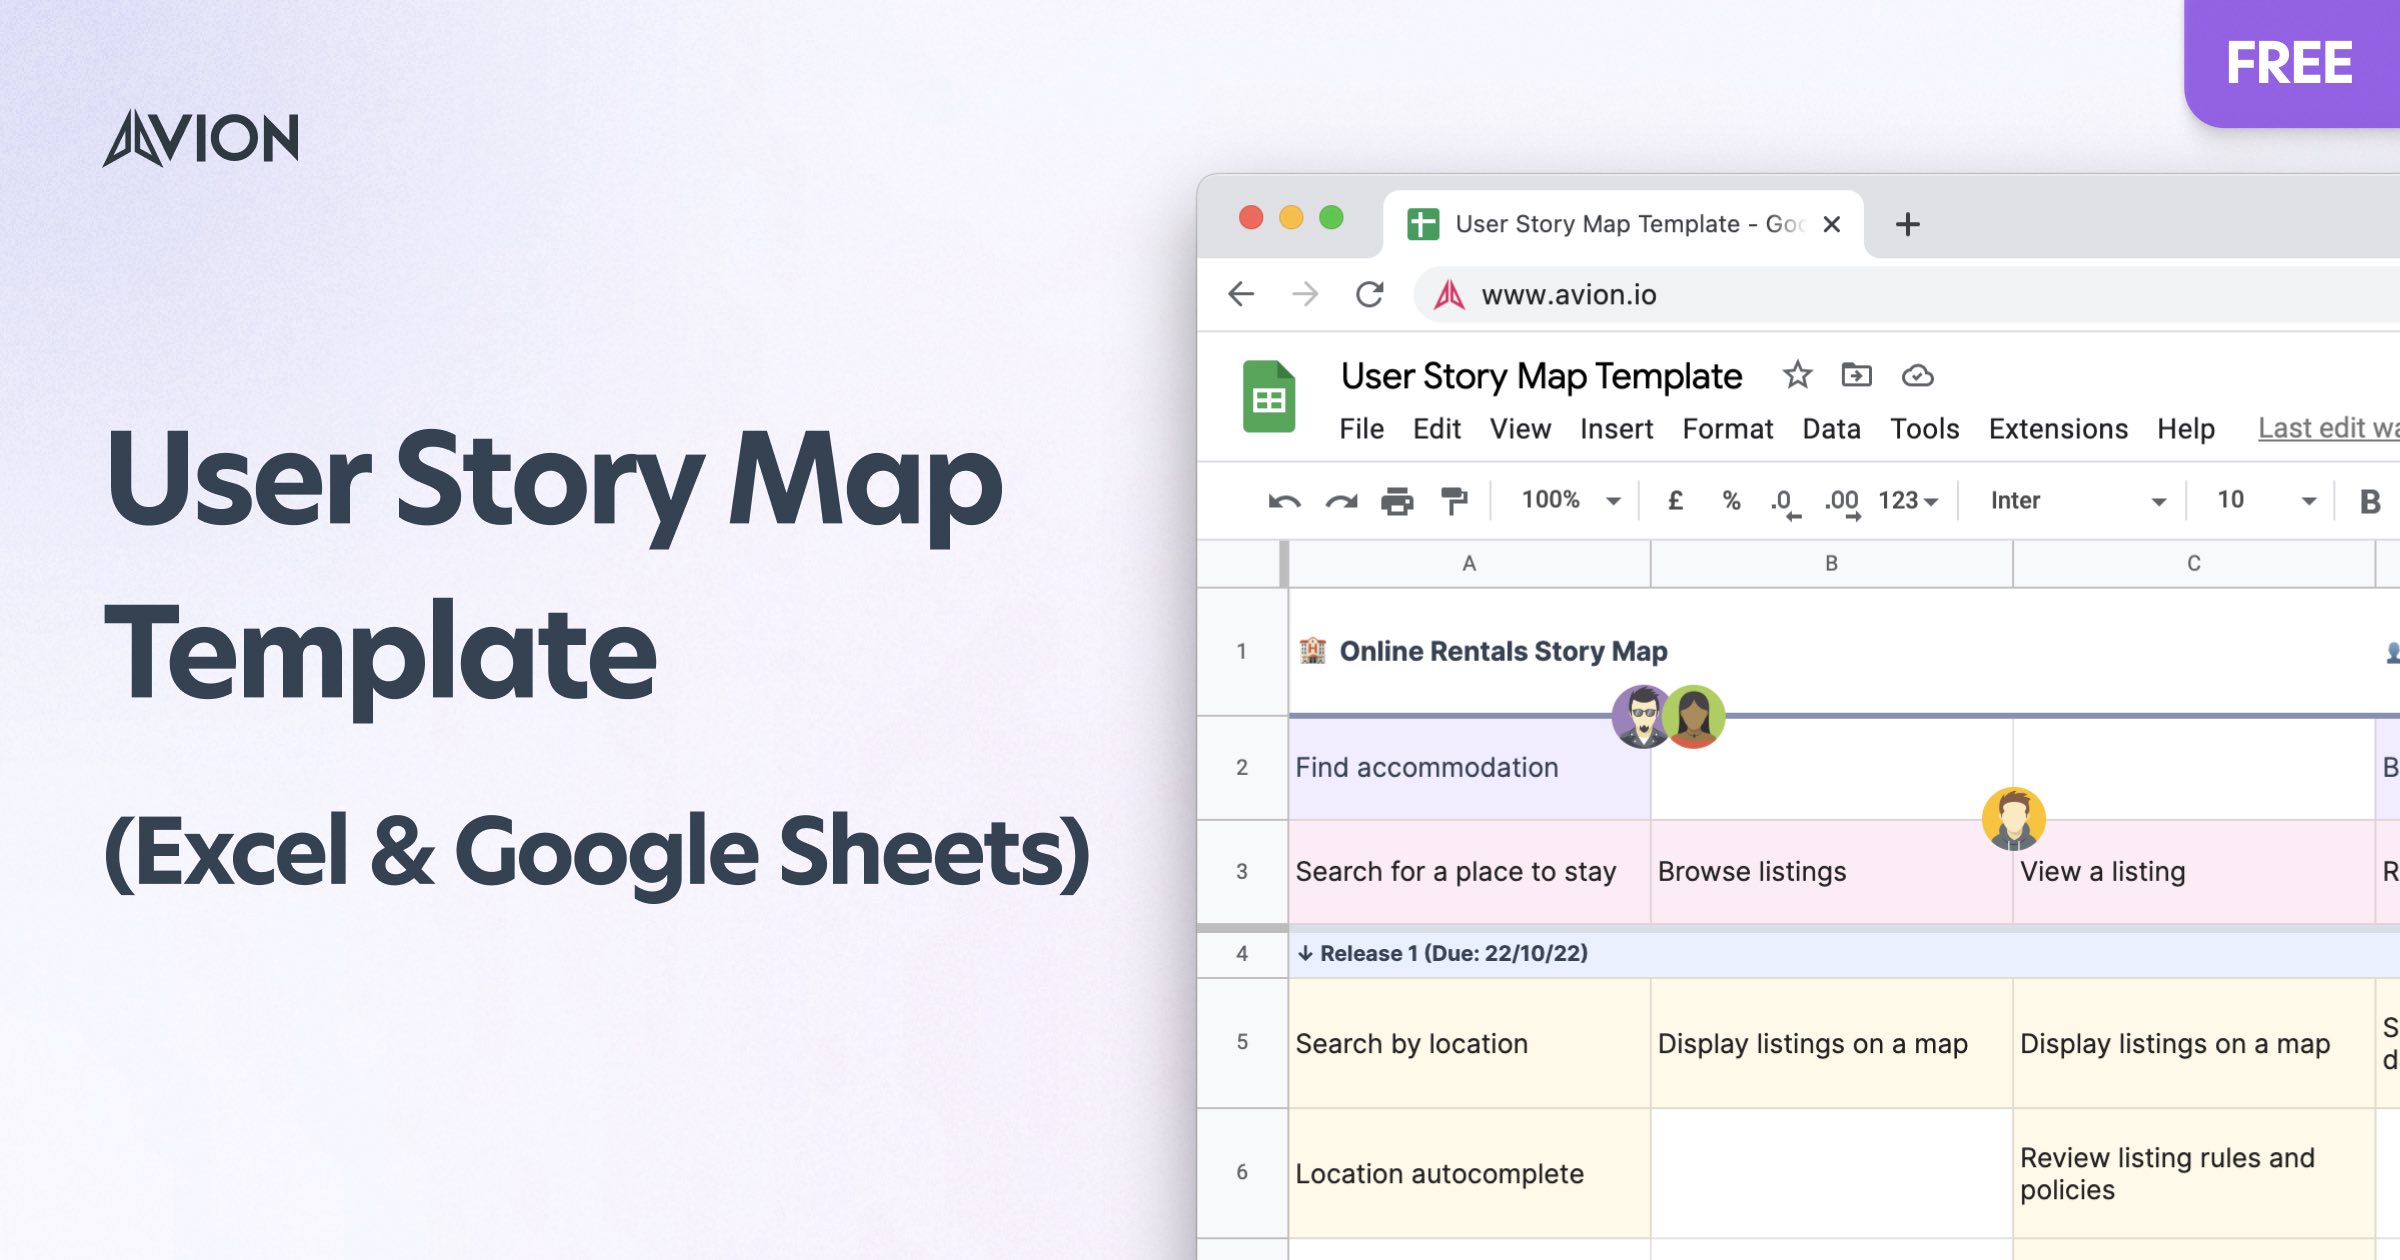
About the template
On this page, you will find a tried and tested user story mapping template, with support for Excel (XLS) and Google Sheets. It’s perfect for beginners, but also enables more advanced story mappers to really get the most out of the technique.
We’ve had years of experience talking to product people and crafting a bespoke story mapping tool, and have used these insights to produce a template that gives you an easy to use, methodical structure that’s true to the original story mapping ethos, created by Jeff Patton.
What’s more, the template does a lot of the work for you! Cells are automatically sized, colored and formatted, so you can focus on the activity at hand, as opposed to spending hours setting up a spreadsheet for story mapping.
Core features of the template
- Proven structure for story mapping
- Proven structure for story mapping
- Supports Excel (XLS) and Google Sheets
- Automatic cell coloring and styling
- Map user journeys, user stories, bugs, blockers and questions
- Support for release planning
- Support for personas
- Full example story map to learn from and extra learning material
What does the template look like?
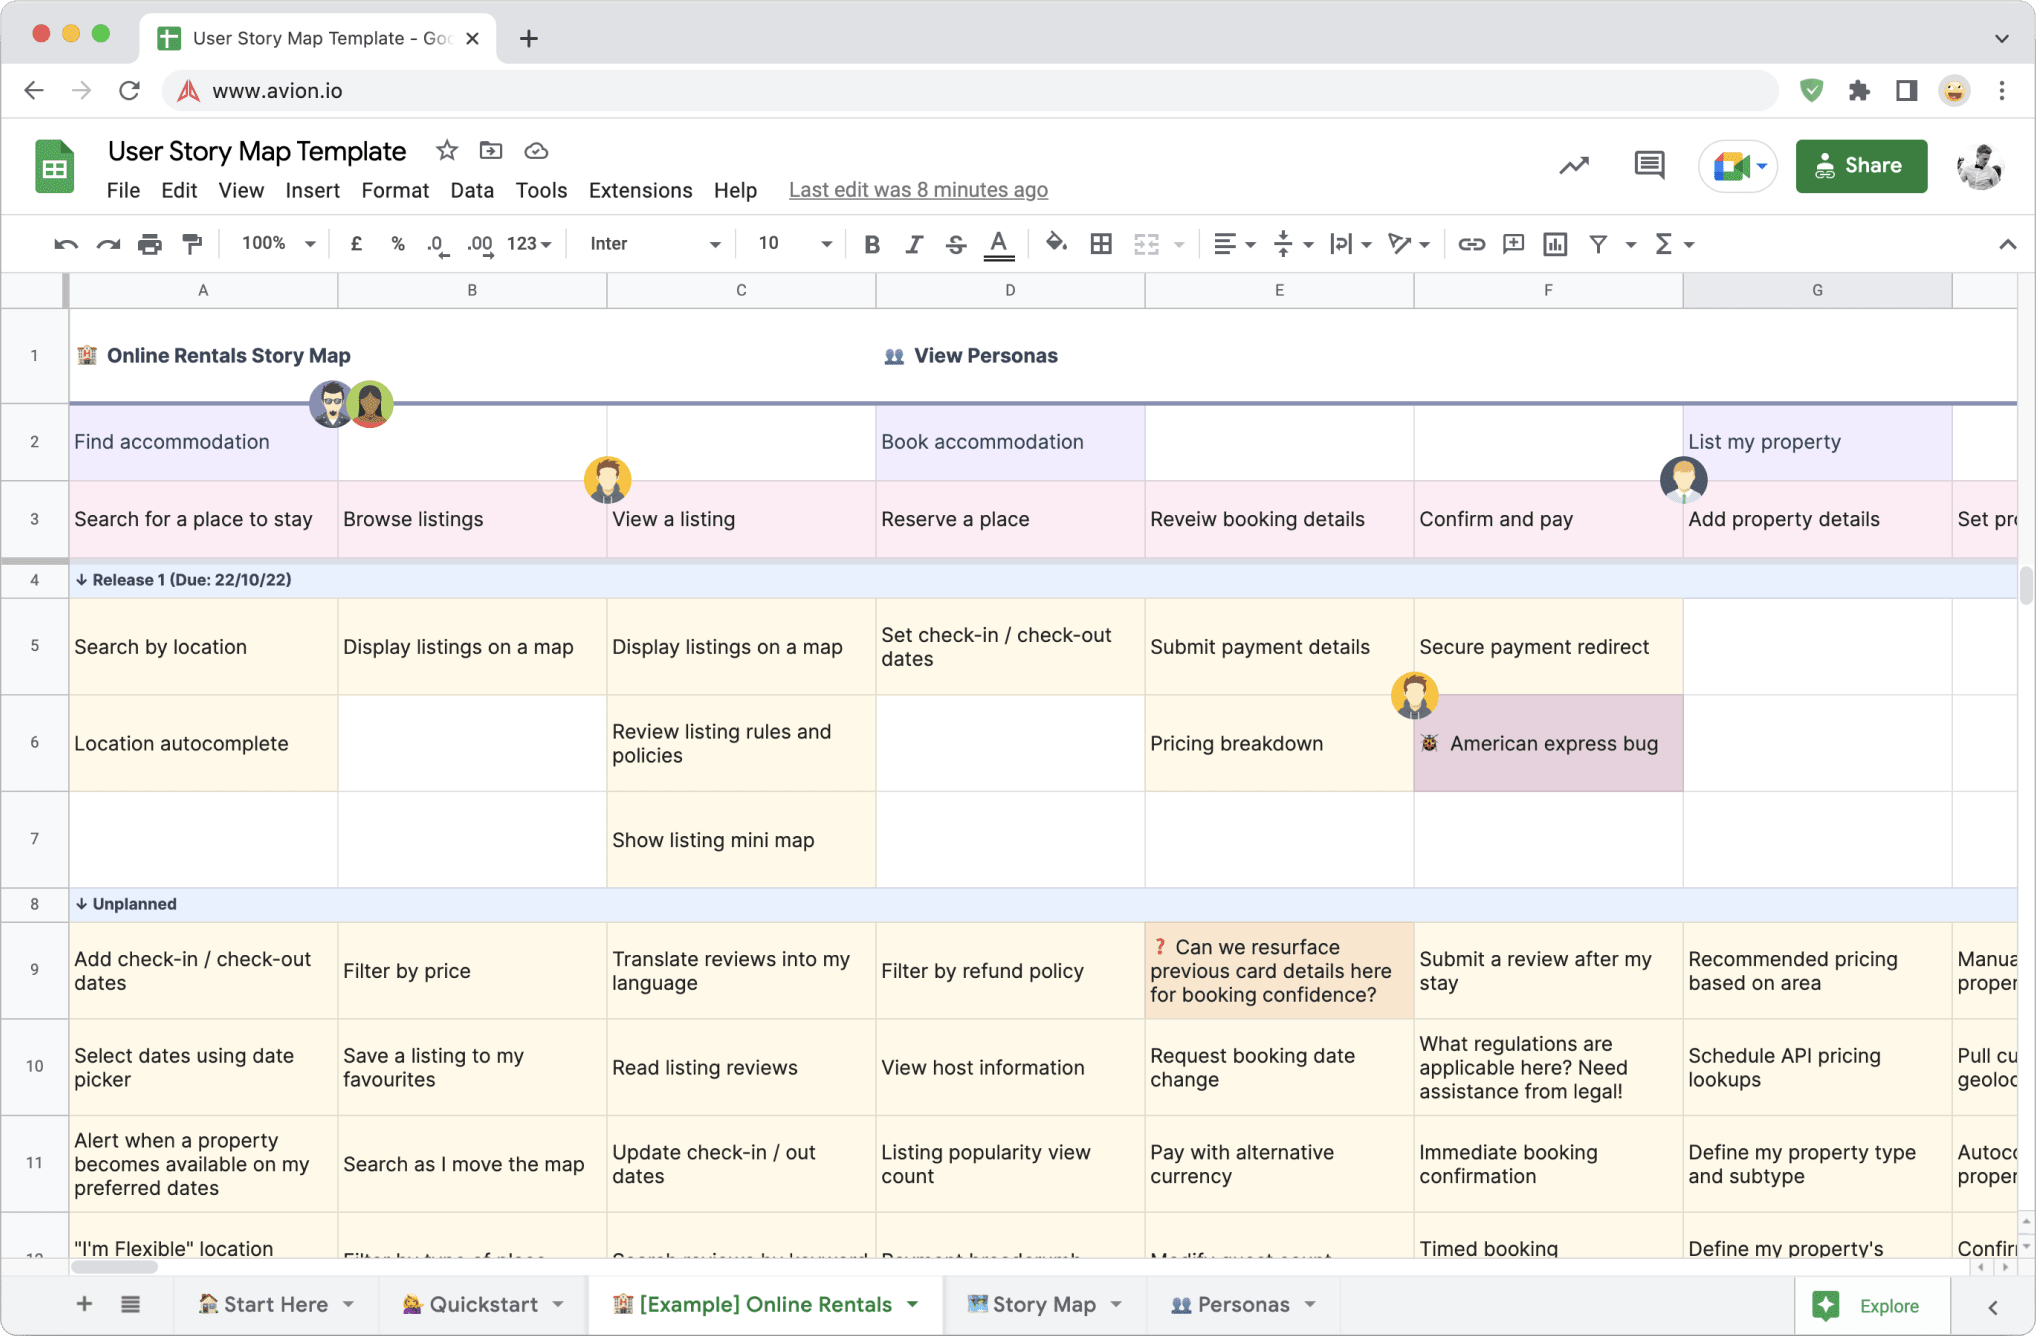
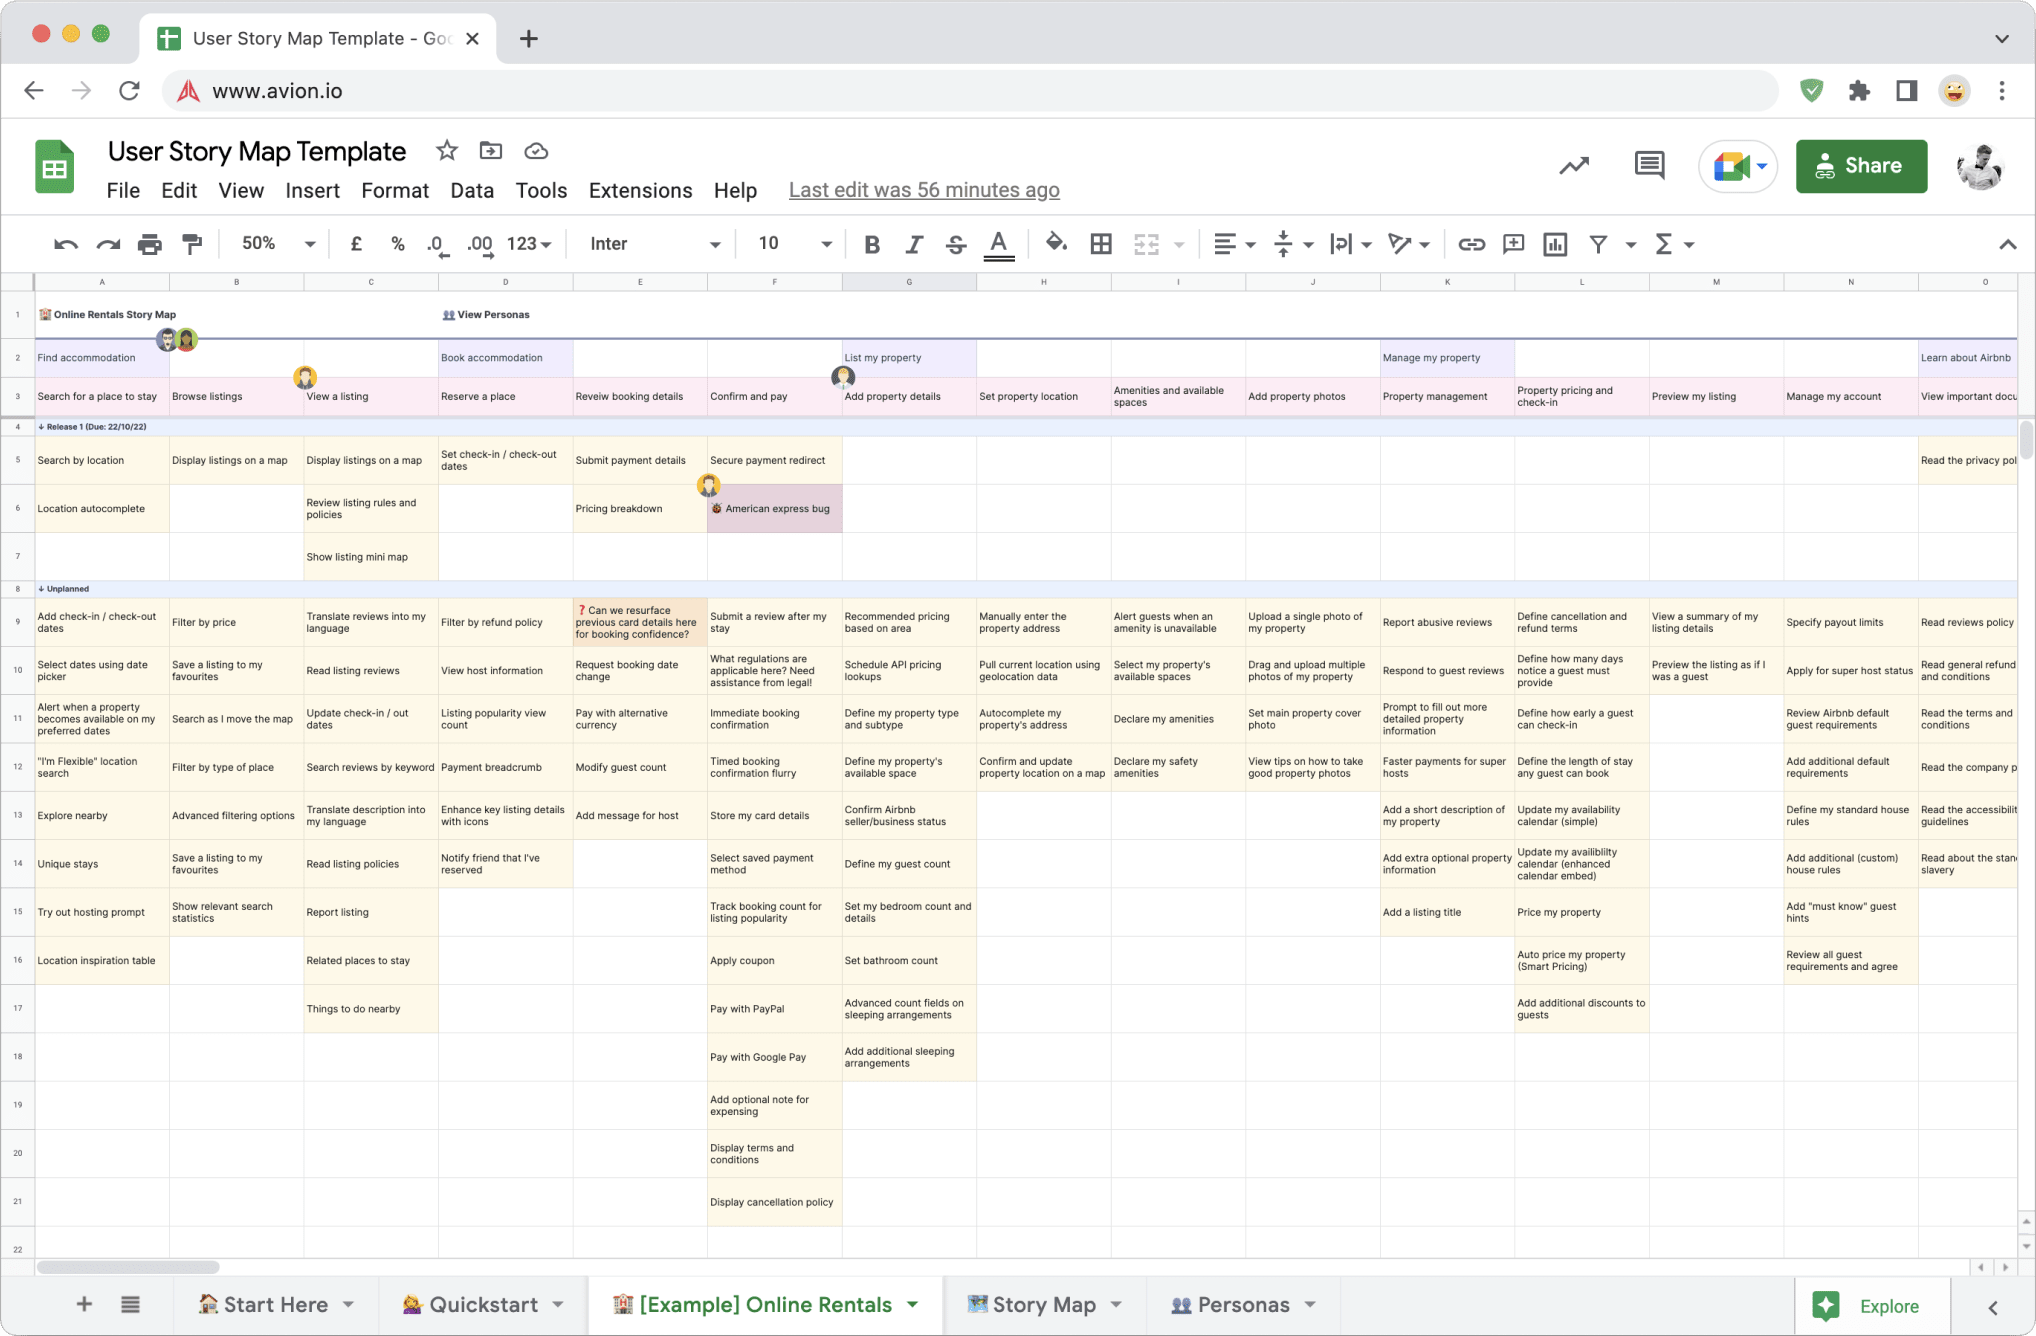
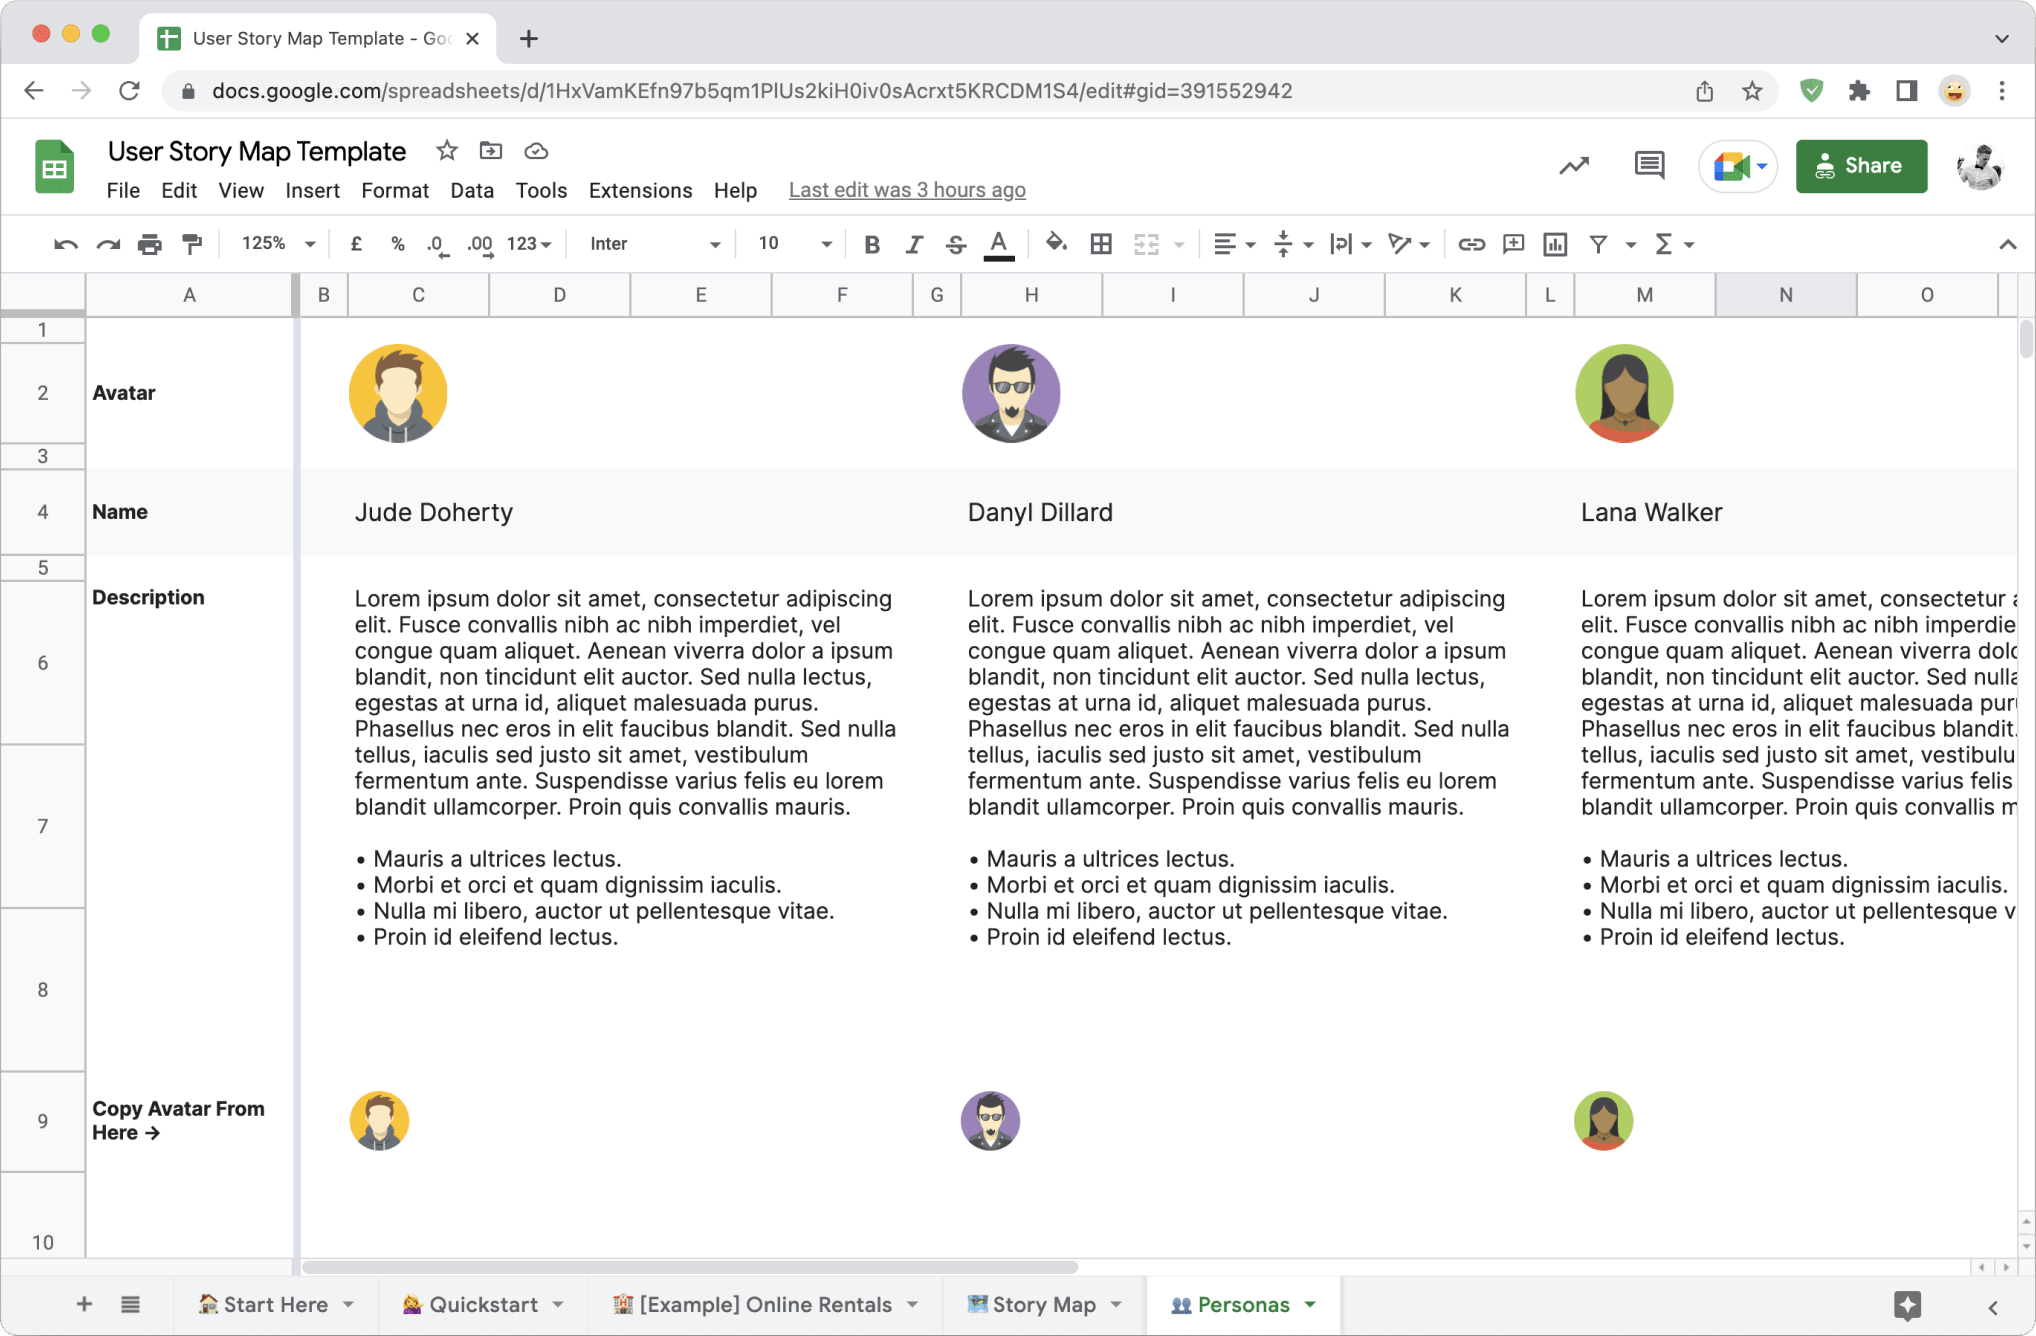
Here are some screenshots of the template, so you can get a feel for what it looks like.
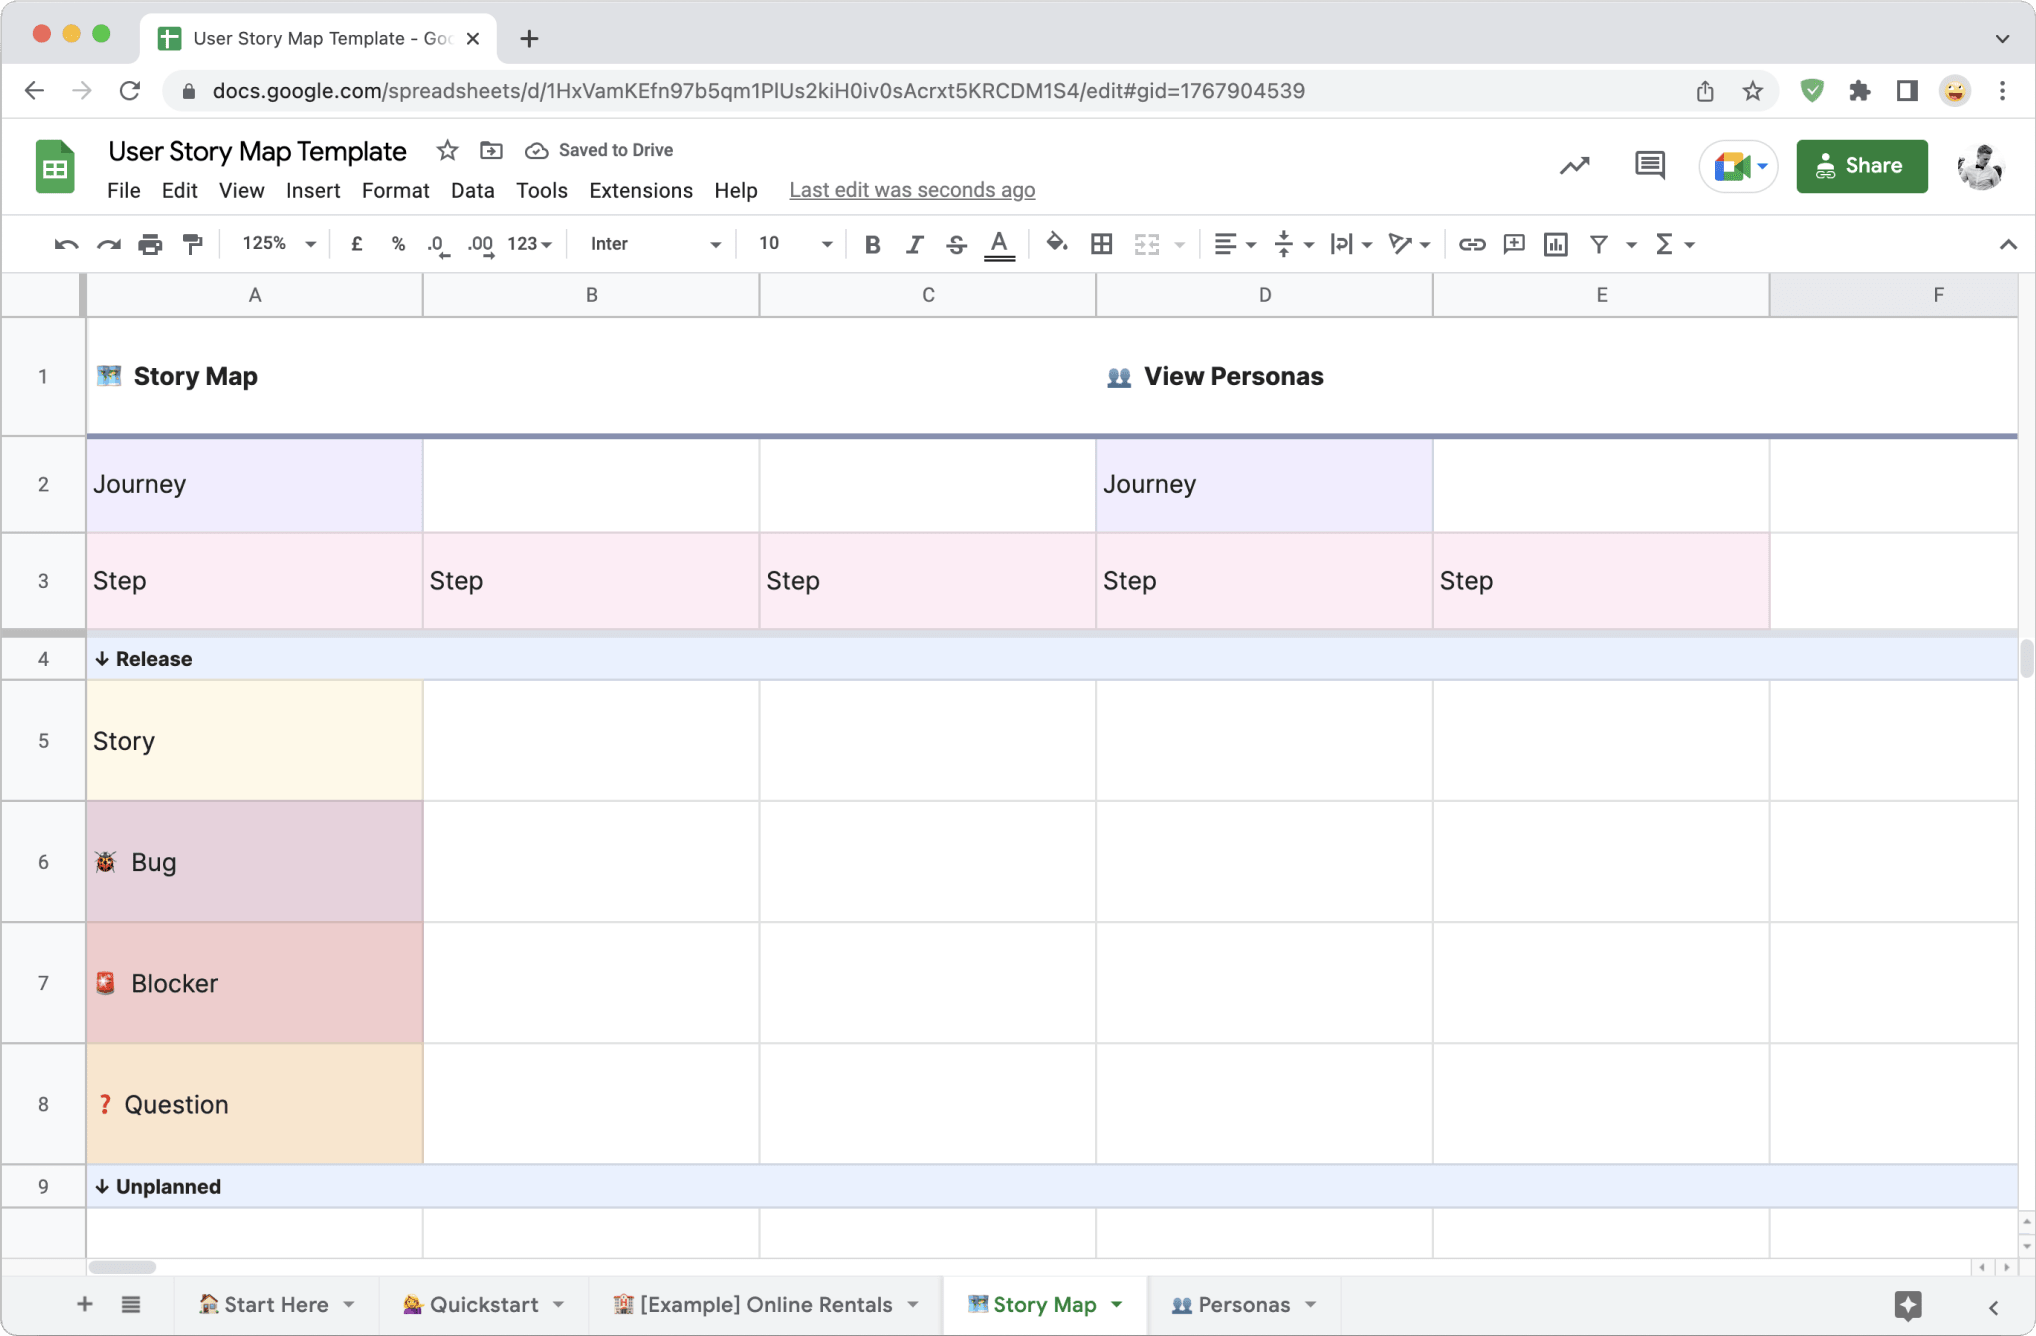
How to use our story mapping template
The template is crafted so you can focus on story mapping, without needing to mess around with styling and structure.
First thing — check out the example map
To get a feel for how the story map is structured and styled, take a look at the Online Rentals tab in the template. This is a story map modeled around Airbnb.
This is the perfect place for you to try to understand the overall structure of the story map, but also envisage how it fits together holistically. Hopefully this will give you some inspiration for your projects and products!
Next — start with a fresh story map
Once you’ve taken some time to digest the example map, head over the Story Map tab. We recommend duplicating this, so you’ve always got it to return to if you need to create a new story map in the same spreadsheet.
Cell A2
First up, be sure to rename your story map in cell A2 (and rename the actual tab too!)

Row 3
The third row is for your journeys. Enter a journey name in here and the cell will automatically turn purple. Journeys describe the overall objective of the user, specific to the product. Check out our in-depth section on journeys to learn more.

Row 4
The fourth row is for your steps. Enter a step name and the cell will automatically turn pink. Steps illustrate the literal “steps” that your users will take to achieve the objective of the journey. Check out our in-depth section on steps to learn more.

Unplanned release
Once you’ve created your journeys and steps (known collectively as the backbone), you can start to enter stories under each step in the unplanned section. This section is known as a release.
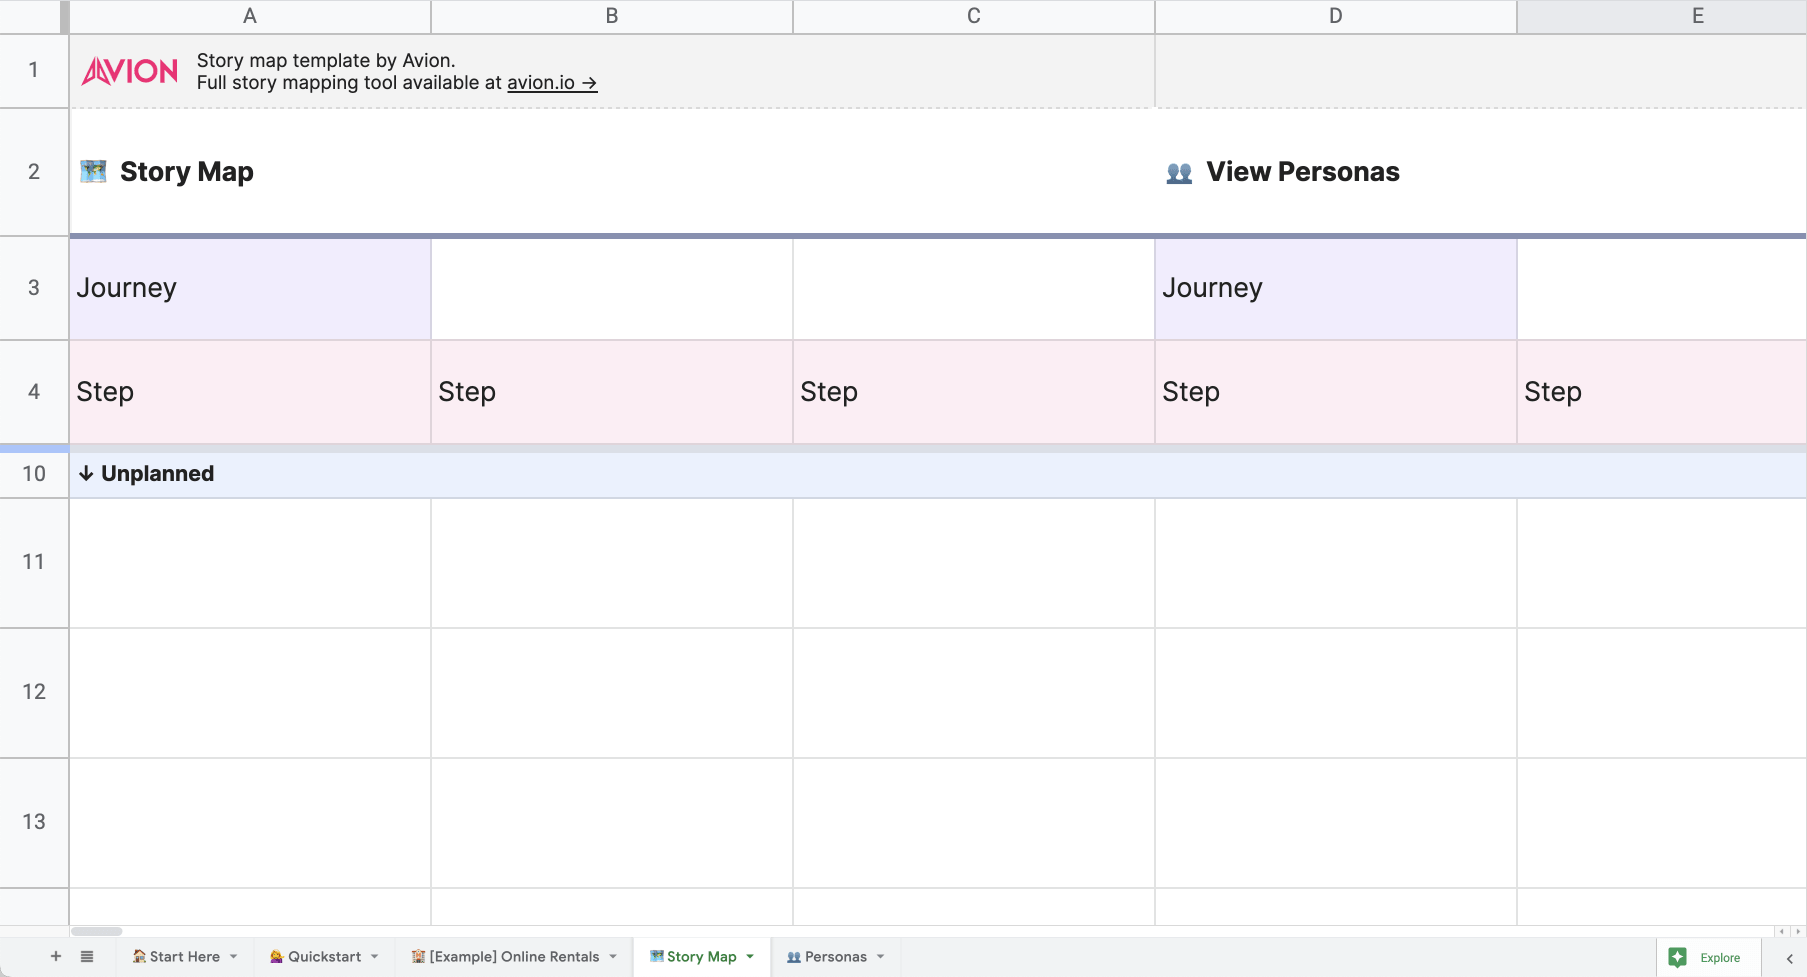
The unplanned release is special, as it’s where you can create your entire product backlog and scope, at least to begin with.
As you create more releases, these will become the buckets of stories that you will need to develop to successfully deliver valuable features to your users.
Creating a new release
Creating a new release is pretty simple once you get the hang of it.
- Highlight from rows 6 → 10 from the starter story map
- Copy the selection with Ctrl/⌘ + C (also keep the selection)
- Right-click the selection and then click Insert 5 rows below
- Paste with Ctrl/⌘ + V
Creating stories
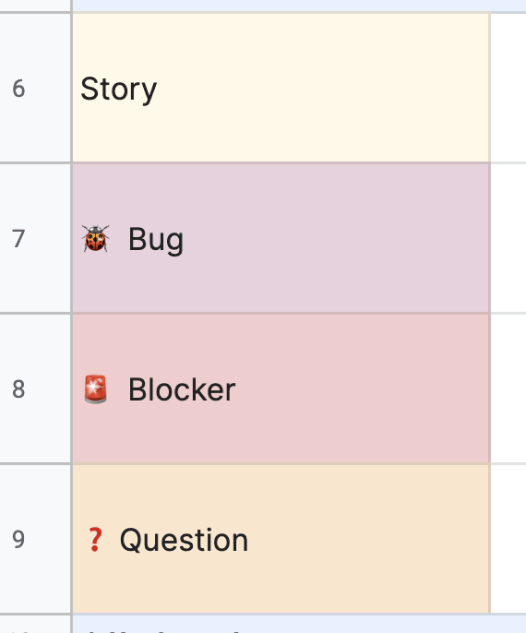
Click in any cell under a release line and just type to create a story. Once you hit enter or move out of the cell, it will automatically turn yellow. This is a user story.
Bugs, blockers and questions
You can also create bugs, blockers and questions by using one of the following emoji in any cell under a release line:
- 🐞 — Bug
- 🚨 — Blocker
- ❓— Question
Bugs will appear in a maroon color, blockers will be red and questions will be orange.
Personas
Use the personas tab to define your product’s most commonly used personas. If you want more information about how personas work within a story map, check out our what is user story mapping article where we touch on the topic.
Once you’ve defined your personas, use row 9 to copy the small avatars into your story map tab. Personas can be used on journeys, steps or stories.
When to use the story mapping template
During discovery
Story mapping is a great exercise to use during the discovery phase of a project. In the discovery phase, you should typically have a solid idea of what problems you are trying to solve for your potential users.
But, you are less likely to know what you’re going to build and how you’re going to build it. User story mapping is the ideal technique to try and identify both the what and the how.
During development cycles and sprints
Story mapping doesn’t need to stop after discovery is complete. Once you have created a story map, you have an artifact of value that will help you understand your product, plan smarter, stay lean and communicate with stakeholders better.
With all that in mind, it can make a lot of sense to include story mapping as part of your development workflow. Why throw away that artifact?
For example, some teams like to use the story map for backlog refinement and sizing. Other teams use it as an initial prioritization tool before stories ever land in Jira or other backlog tools.
In this case, it allows you to keep tools like Jira a little cleaner — focusing more on the delivery side of things. The story map is then used as a planning and prioritization tool.
Check out our in-depth guide for more information on when story mapping should be used.
Download the user story mapping template
Advanced features and customization
Once you feel comfortable with the template, you might want to explore some more advanced customization options.
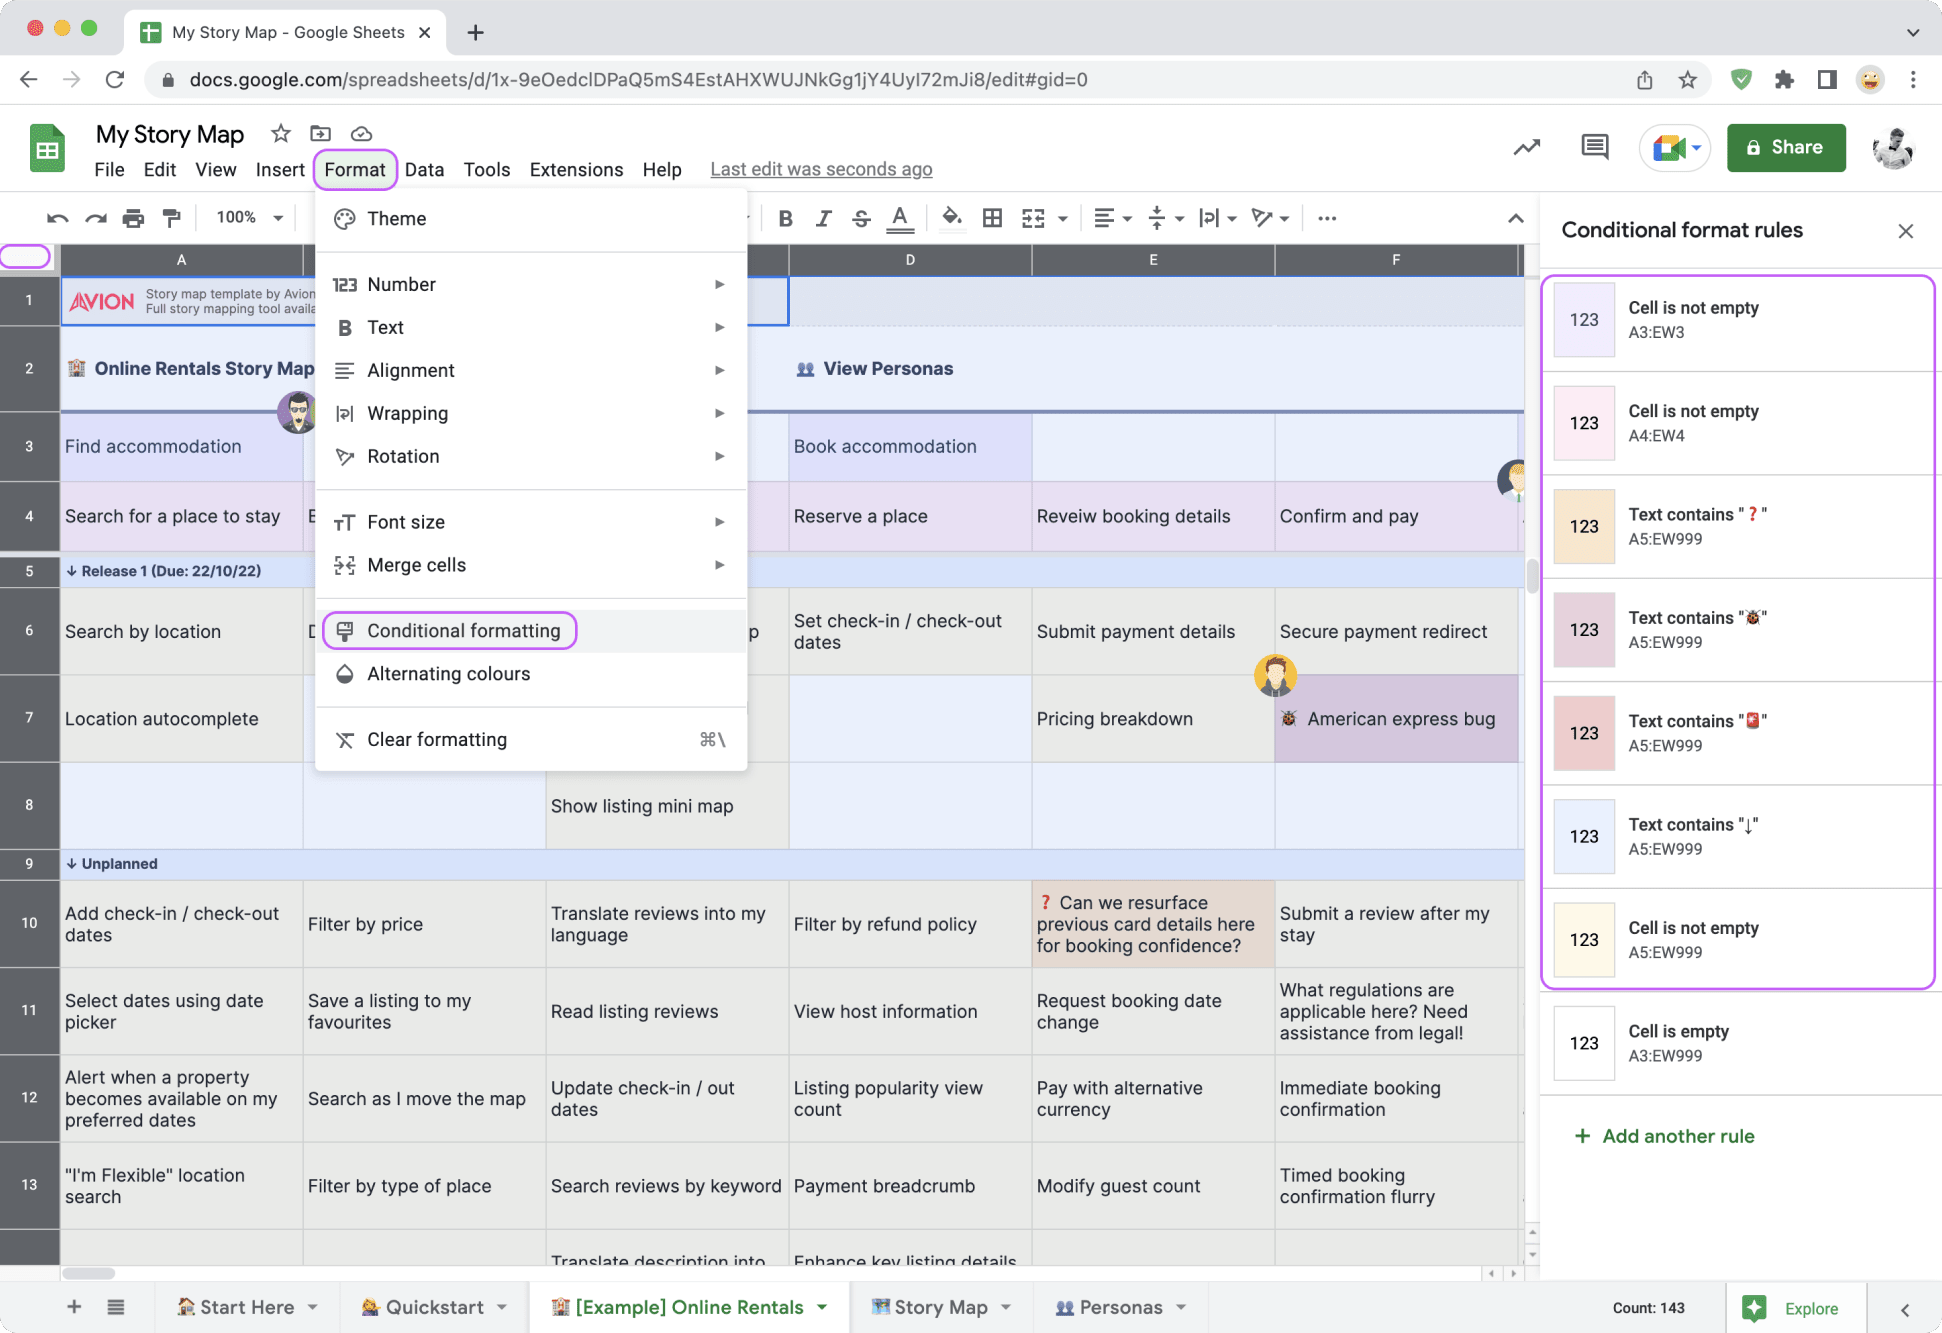
Changing card colors
Google Sheets
- Click the top left square, to select all cells
- Click Format → Conditional Formatting
- Select a card format to change by clicking it
- Change the card colors and format
- Create your masterpiece 👩🎨
Microsoft Excel
- Click Format → Conditional Formatting
- Under Show formatting rules for, click This Worksheet
- Select a row to change and click Edit Rule
- Under Format with: click Customized Format…
- Tweak until your heart’s content 💕
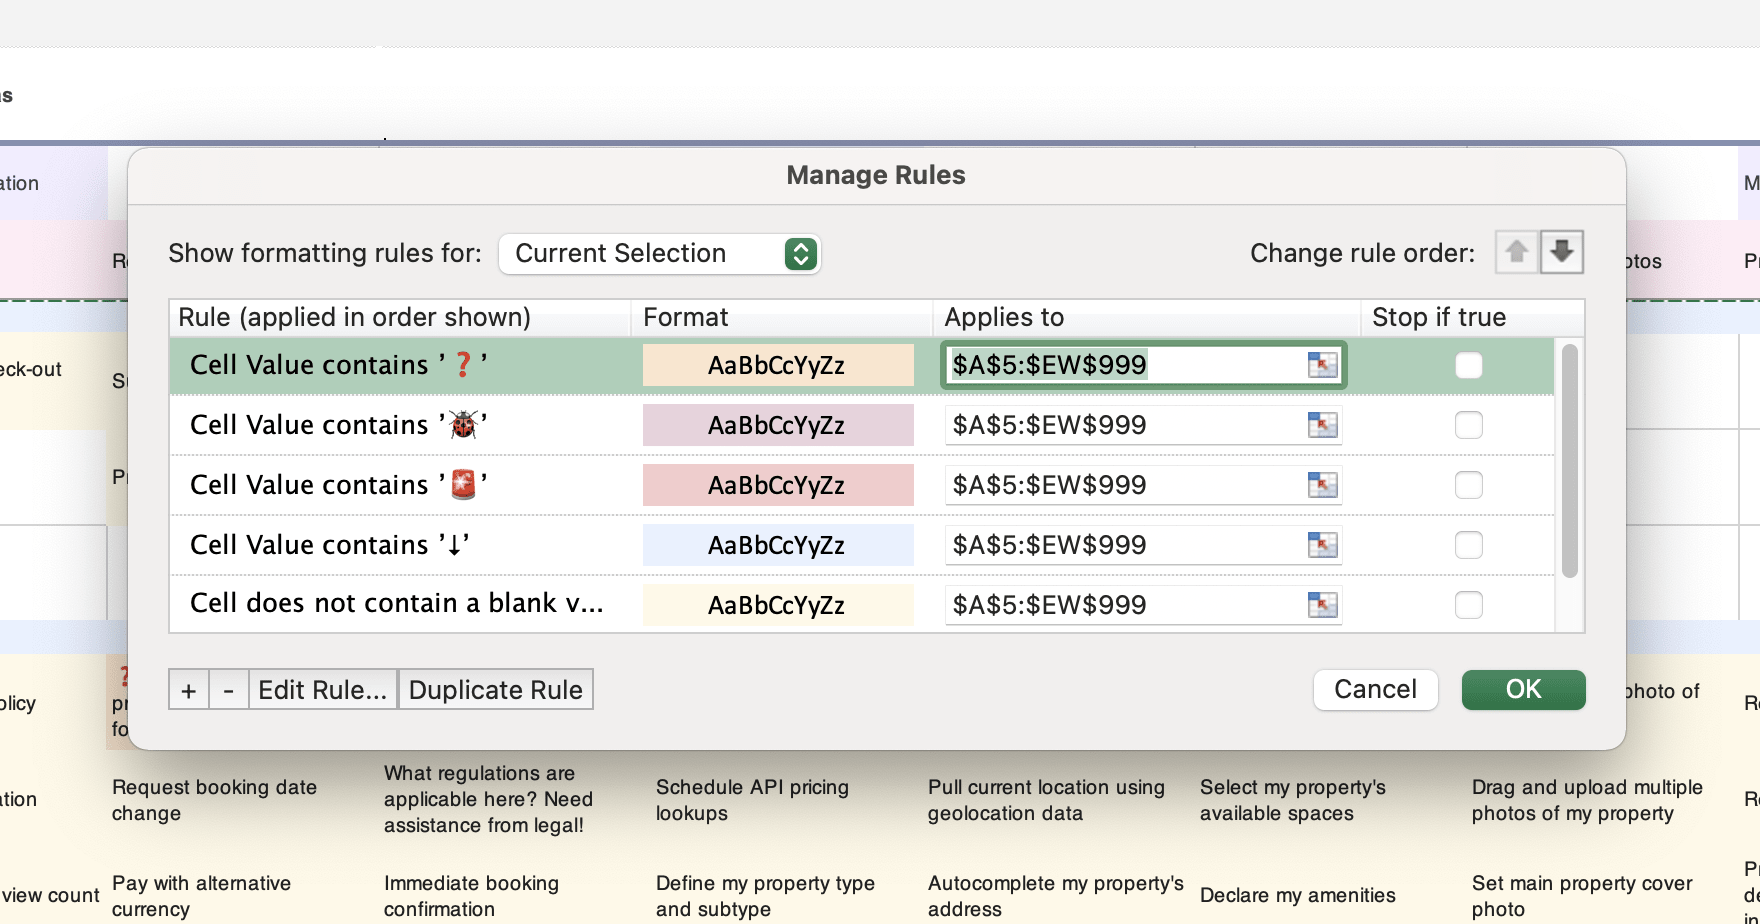
Remember that conditional formatting in both Excel and Google Sheets is specific to the tab / worksheet.
Increasing the scale of the story map (zooming)
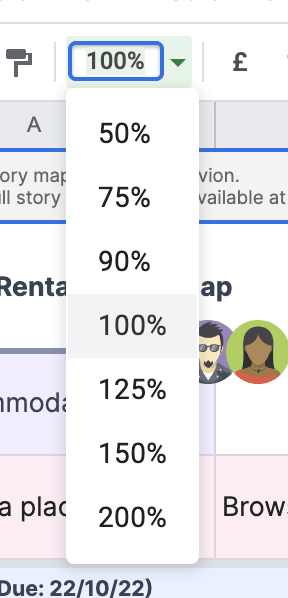
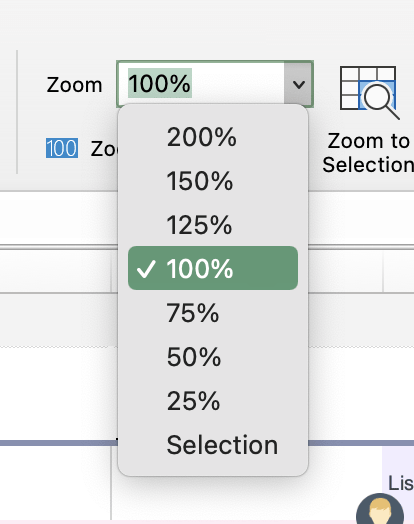
Use the zoom controls, instead of editing the font sizes to change the overall scale of the story map. This keeps everything in proportion, relatively.
Hide the formula bar
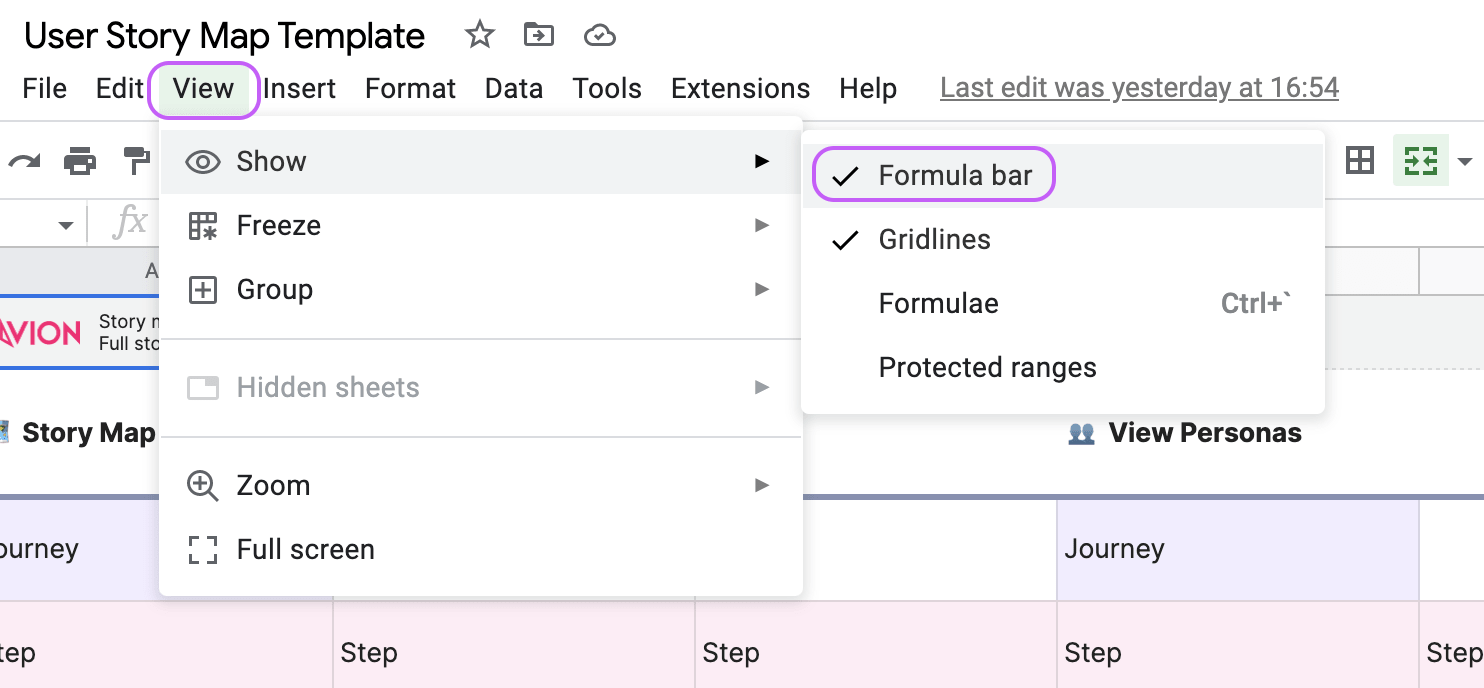
For story mapping, the formula bar is not really a necessity. Try hiding it to give yourself more space and viewport for the story map.
Both Google Sheets and Excel support hiding the formula bar.
Limitations of this template
Persona positioning
Personas load in the wrong place in Google Sheets occasionally. You can just hit refresh to fix this. Thankfully, this is not a problem in Excel.
Story descriptions and other metadata
This template does not support adding detailed story descriptions, or other metadata that can be useful when fleshing out your user stories.
Getting data into Jira (or other tools)
There is no simple way to get stories from this template into tools like Jira, Trello and Azure DevOps. Data will need to be manually copied in.
It’s missing a few key story mapping features
Tagging, dependency mapping, attachments, decent comment chains are all out of scope with this template. We’ve focused on creating a robust, but basic story mapping experience.
Solutions to these limitations
Be aware that this template is only touching the tip of the iceberg in regard to story mapping. If you want to get more from the technique and address the limitations of this template, you should a better tool for the job.
Why not try a dedicated story mapping tool?
Avion is a story mapping tool made for remote and hybrid product teams and follows a similar structure to this template, with much, much more! Try Avion for free today.
FAQs
What is a user story map?
What are the benefits of story mapping?
- Build shared understanding
- Bring the product team together
- Transform big ideas into development plans
- Encourage smaller releases and shorter release cycles
- Inspire lean thinking and discourage over-building
- Facilitate more productive prioritization with stakeholders
- Onboard new team members better
- Separate your product backlog from your sprint backlog
Continue reading
 Product managers are creators. They’re problem solvers. They facilitate solutions that people value.Read more

Lean Agile – Bringing Them Together To 5x Your Delivery
Lean and agile have a lot of similarities. They both focus on rapid, iterative development in order to deliver value to customers faster and avoid wasted development time by producing unnecessary features.Read more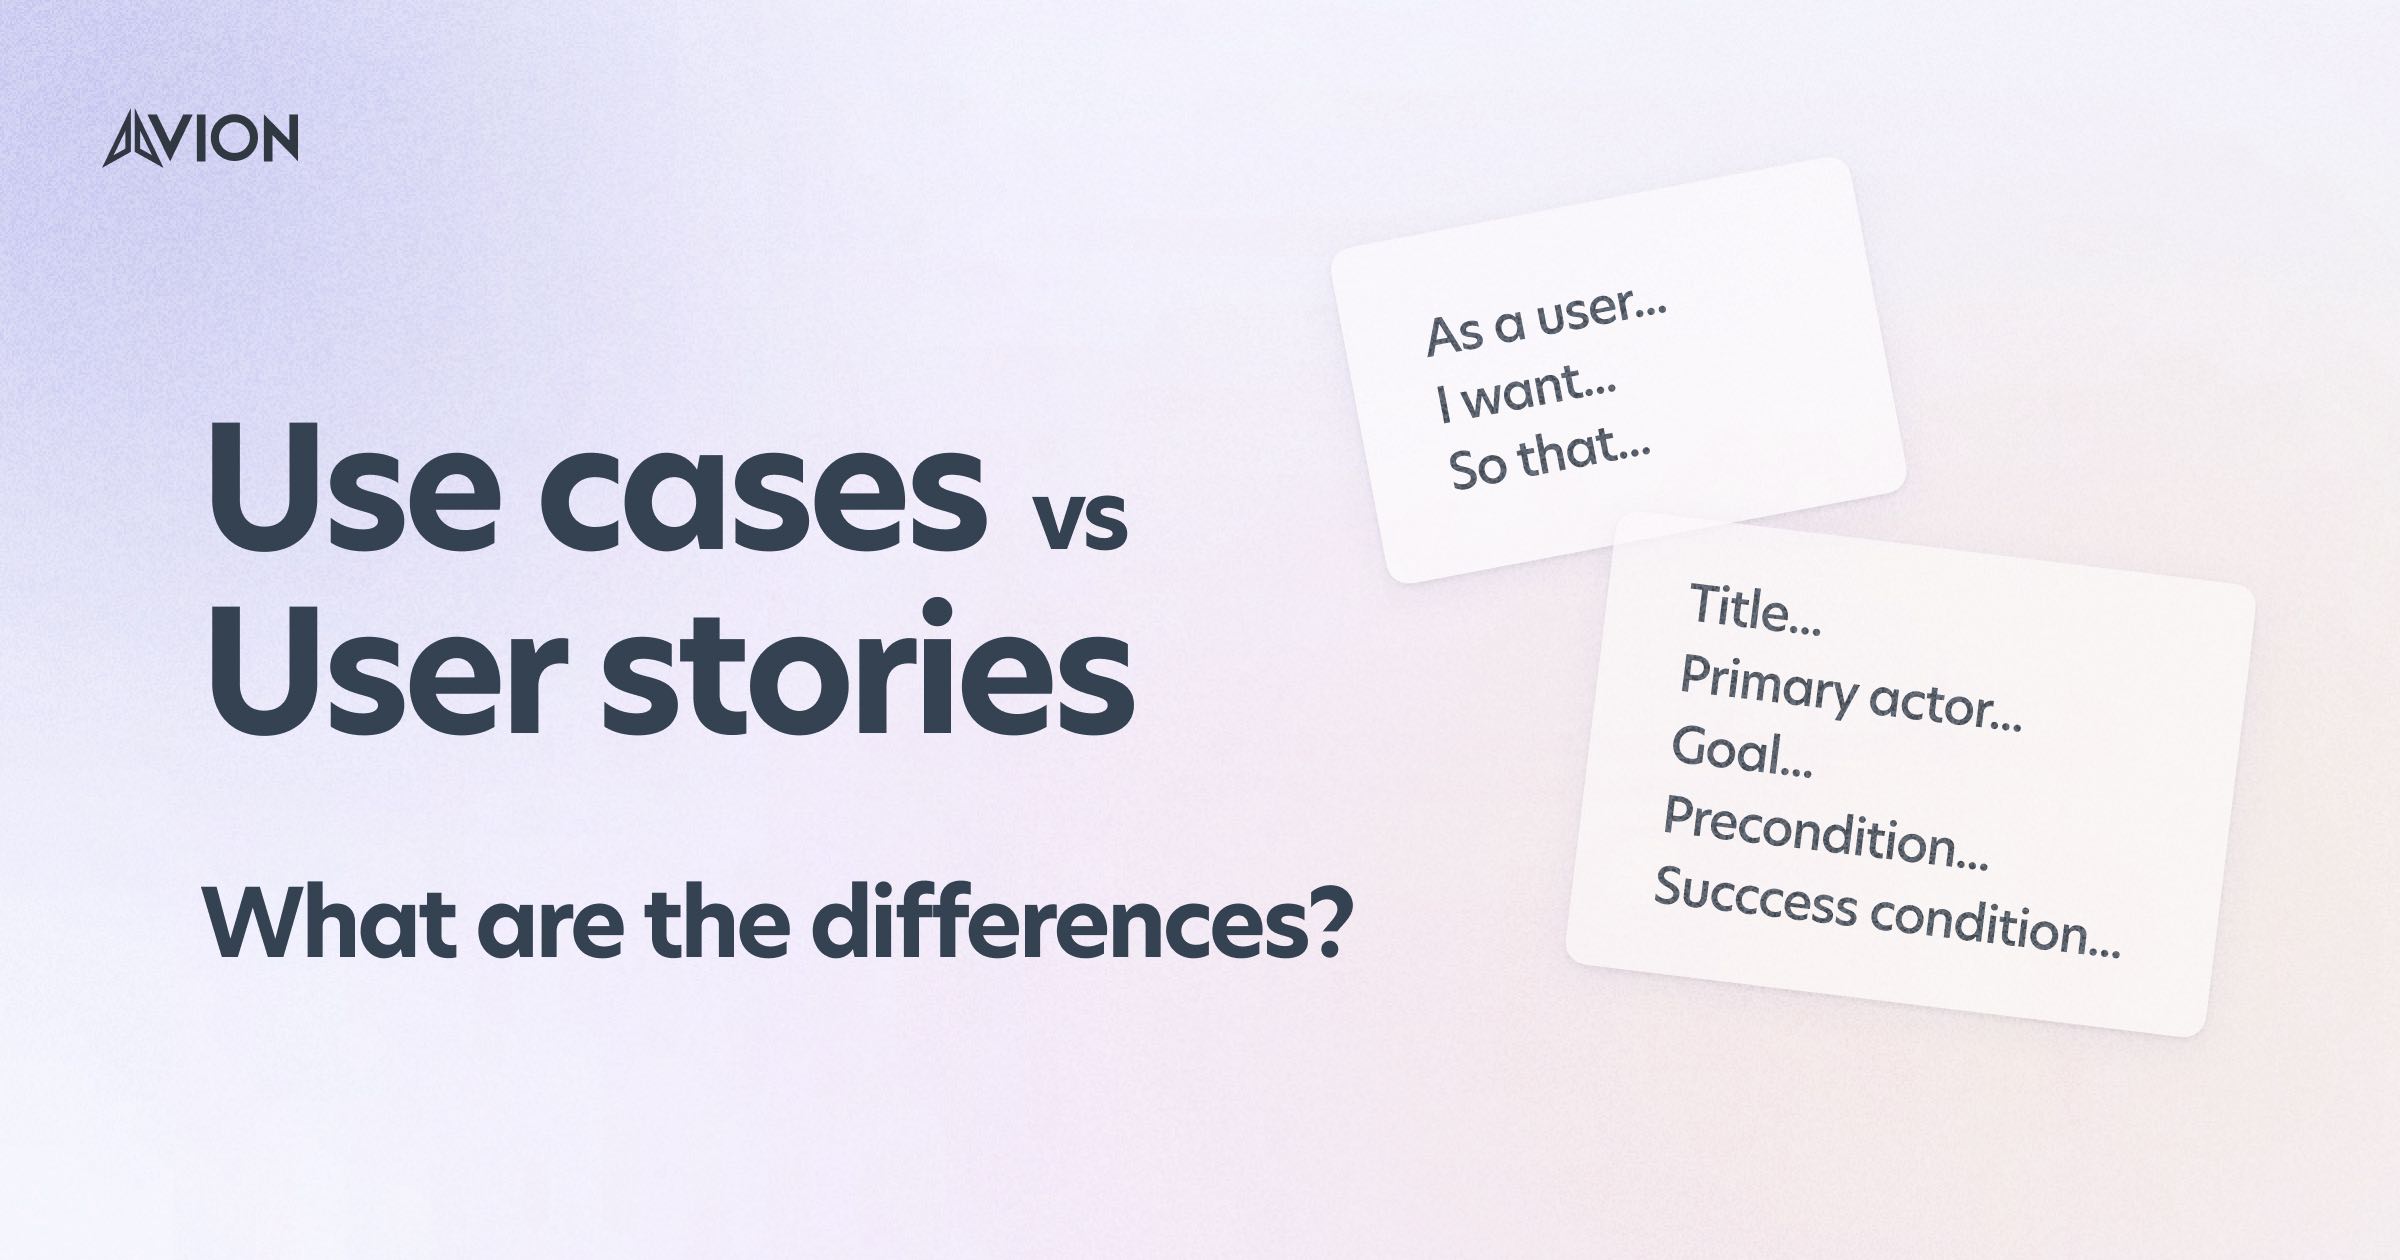
Use Cases vs User Stories. What Are The Differences?
Whilst user stories and use cases were both designed to describe the expected system behavior from a user's perspective they are two very different tools. And whilst they do share similarities they have far more differences. Let's dig in.Read more